Wednesday, October 1, 2008

How to align my objects better? - let "snap" be your friend.

In my earlier post about creating a Likert scale (as well as in subsequent posts about scale-creation), I mentioned that you could use the grids on the Excel spreadsheet to help align the Option Buttons that you create.

However, you may notice that no matter how you try to align them, it just doesn't quite work - some of them still look out of line. Even then, lining up the buttons against the gridlines is a tedious exercise and increases the incidence of short-sightedness. I have the glasses to prove it.

Excel can force the borders of your Option Buttons (or check-boxes, sliding bars, buttons - collectively called Controls) to snap against the gridlines.

In Excel 2003, this is easy:

  • Bring up the "Drawing" toolbar (right click on an existing toolbar; tick "Drawing)
  • Click on "Draw"; then choose "Snap" --> "Snap to Grid".

A tiny bit trickier in Excel 2007:

  • First you need to draw some kind of shape on your sheet. A circle, square, what-not. You can delete it later.
  • Select that shape. That brings up the "Drawing Tools" command in the Ribbon. Go to Drawing Tools --> Format --> Arrange --> Align.
  • Choose "Snap to Grid".
  • Remove the shape you created.

Now, when you move your Control, you see that it turns into a dotted box, which would snap against the gridline when you move close to it.

Stay a step ahead,

Alex.

Tuesday, September 30, 2008

Changing Pages - An introduction into VBA Codes

First of all I apologise for the recent slackness, I've had a change in computer, which necessitated a few changes in applications and hardware. Glad to be back on line.

In the last few weeks, the topic of discussion had been how to set up various scales - Multiple Responses, Continuous, and Likert. I haven't written a single word of code yet. All that is about to change - we're going into Visual Basic for Applications (VBA) codes.

This is triggered by a colleague's query. He is writing a study which involves two questionnaires, with the manipulation and filler questions in between. Easy enough to just put them all into a single Excel file, let the participants scroll down, right? No - it's a memory study; therefore he does not want his subjects to see their response to the first survey by the time they reach the second survey. With its current setup, subjects can easily just scroll back up, and they remember exactly what their response was. The manipulation and fillers in between would be rendered useless!

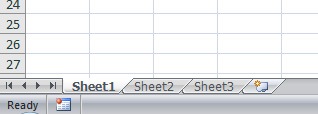
One way to do this is to put the surveys, manipulations and filler questions into separate sheets in an Excel file. Ordinarily, you navigate between the sheets by hitting the tabs at the bottom of your sheet:

080930_001

But once again, same problem: participants can easily return to the sheet that contains their previous answers, and cheat their way in subsequent questions. We need something that allows participants to (1) easily switch pages and (2) can't go back to see their previous answers.

Say hi to VBA Land!

The Visual Basic Window

To access this window, press Alt-F11 (or it is available under Tools --> Macro --> Visual Basic).

Go to "Insert" --> "Module".

080930_002

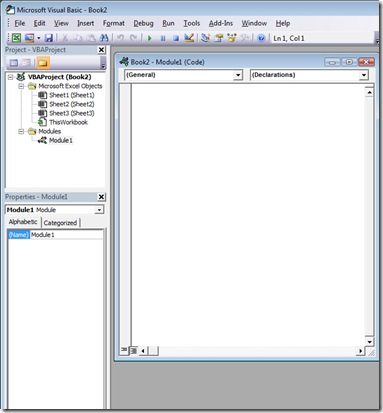
Now, get ready to write you first codes: In the "Module1" box, write the following:

Sub ChangePage()

Then hit enter.

You will notice that, two rows below that, the words "End Sub" would also appear. That is normal - "Sub" stands for Sub-Procedure, which are commands that tell Excel to automatically carry out certain instructions automatically. Also, the word "ChangePage" carries no significant meaning - you can change it to "PageChange", "Page1to2", or "Mickey Mouse" as you please - so long as you remember what it's for. That whole bunch of codes you just wrote is called a "Macro"

(Just a note here: as I said earlier on, as much as I'd love for this to be a one-stop shop for all VBA-related queries, that is just not possible. Not only do I have a lot to learn about VBA; I'm just not completely up to speed with every technical detail involved in VBA programming. For a pretty good summary of the technicalities of VBA, see this tutorial from FunctionX.)

Now, in the space between Sub ChangePage() and End Sub, type the following:

Sheets("sheet2").Visible = True
Sheets("sheet2").Select
Sheets("sheet1").Visible = False

Now your Module1 should look like this:

080930_003

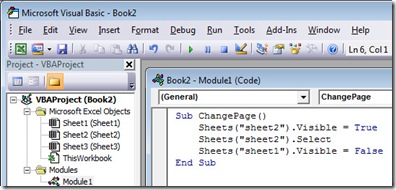
(You might wonder why "Sheets..." are all indented. Excel VBA does not automatically do that for you. I prefer to keep relevant blocks of codes indented, so I can find them easily. This is not so important now - it won't affect its performance - but will be very useful when you have bigger blocks of codes.)

Not meaning much to you? Don't worry. Let's move on to see how to put this jibberish into action.

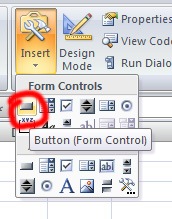
Go back to your blank Excel sheet and choose Sheet1. Go to Developer --> Controls --> Insert --> Form Controls --> Form Control.

080930_004

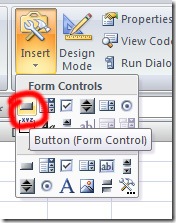
(In Excel 2003, you have to right click in your menu bar, tick "Controls" to bring up the Controls toolbar. You should see the button in that toolbar.)

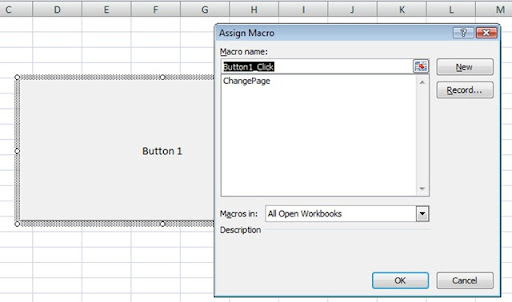
Once you have selected the Button, either click somewhere on the sheet (which will bring up a button with default size), or drag it on the sheet to create a button with your desired size. I did the latter because I like to control. When you release the mouse button, a dialogue box appears as follows:

080930_005

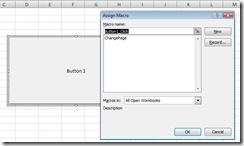
You are now asked to assign the Macro to this particular button.

Notice that the Macro we created earlier, ChangePage, is in this box. In fact, the "Assign Macro" box would contain every Macro that you create. Select ChangePage, and press OK. That would make your new button follow the ChangePage procedure we just created. Click OK, click anywhere on the sheet, then click on the button.

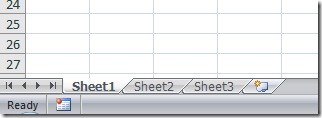
Yes, you should find yourself in Sheet2, with Sheet1 nowhere in sight. The ChangePage Sub-procedure that we created has served the purpose of switching to another sheet, and hiding the first page.

This method is not entirely fool-proof. A slightly Excel-savvy subject could bring Sheet1 back by going to Format --> Sheets --> Unhide, and choose "Sheet1" from the dialogue box. (By the way, that's how you could bring Sheet1 back yourself.) How to get around that requires a little security - that's for another article.

So the take-home points are:

  • The Visual Basic window is where you write commands - or Macros - to run automated actions.
  • The Macro can be assigned to a control - most commonly a button - to become useful.

Stay a step ahead,

Alex.

Wednesday, September 24, 2008

How do I record Multiple Responses (check boxes) using Excel?

In my last few postings, we have looked at how to create Continuous Scale and Likert Scale using Excel. Today we will do Multiple Options Response.

This is not quite the same as a Multiple Choice Question. In MCQ, you are only allowed one option out of several. Here, you can tick a number of different options simultaneously. An example would be the following:


(Clearly, I've never been to Antarctica.)

Creating the tick-boxes follows the same way as you do for other controls that we have already discussed:

  1. Developer -->; (Controls group) -->; Insert --> Check box (under "Form Controls").
  2. Click on the sheet where you want the boxes to go.
  3. Feel free to remove the words "Check box 1".
  4. Go to the cell on the right of the check box, and type "Africa". That is your first option.
  5. Select the check box (by CTRL-left click); Copy (CTRL-C); Paste (CTRL-V)
  6. Move the pasted new check box to wherever you want it. Use the sheet's gridline as a guide.
  7. Repeat steps 3 to 6 to complete your question.
Now, unlike Option Buttons (for Likert Scales/MCQs), you don't need a Group Box to group them together. Each Check Box will have its own Target Reference (remember? it's the cell which records the response.) Determine your Target Reference as follows:
  1. Create a new sheet called "Data".
  2. Select the first Check Box (which you'd have labelled "Africa").
  3. Go to the Formula Bar, type = (equal sign)
  4. Go to the "Data" sheet (don't click on any other cells as you do that!).
  5. Click on Cell B2. (This should turn the border of B2 into a flashing dotted line)
  6. Hit Enter.
  7. Go back to the sheet where your questionnaire is; repeat 1-6 (but use a distinct Target Reference for each Check Box! A logical way would be to put "Antarctica" into C2, "Asia" into D2, and so on.)

Now, check the boxes for Antarctica, Europe and North America. Go to "Data", and you should see this:


"TRUE" denotes that the box has been ticked; "FALSE" indicates otherwise.

Now, try deleting all the "TRUE" and "FALSE". Go back to your questionnaire. You will see that none of the boxes are ticked. This is essential as you prepare your study session, as you do not want to give your subjects perconceived ideas.

Stay a step ahead,
Alex.

Tuesday, September 16, 2008

How do I record a continuous scale on Excel?

In my last post, I have covered the basic mechanisms of creating survey scales and how to record them, starting with the ubiquitous Likert Scale. Today I will cover how to do Continuous Scales.

An example:

“How happy are you with this product?"

Can be captured by either a Likert or a Continuous scale. It is not my role to pontificate which of the two is preferable; suffice to say that a continuous scale can be broken down into categories if desired; a Likert scale cannot be built back into a continuous scale.

Excel offers the Scroll Bar control to capture this kind of data. It can be found, once again, in Developer --> Controls --> Insert:


Once selected, your mouse cursor turns into a cross. Simply drag it across your worksheet to produce a familiar-looking scroll bar. Re-size it by dragging its corners (Control-Click; release control; drag).

To record its value, select it, click in the formula bar, press "=", and click on your desired Target Reference (ie. where you want the recorded value to go - see my
last post), and hit Enter.

You should notice that nothing happens - until you start dragging the scroll bar button (the thin little stripe between the two arrows - it doesn't have to be this thin, depends on how you size the scroll bar itself.) In the example below, I have set the Target Reference to H2 (or $H$2); and the scroll bar is moved to indicate 20.


Excel sets the following defaults:

  • The maximum value (if I drag the scroll bar button all the way to the right) is 100;
  • The minimum value (all the way to the left) is 0;
  • The incremental change (each click of the arrow) is 1;
  • The Page Change (if I click in the scroll bar, but not the scroll bar button) is 10.
What if I want a Scroll Bar that counts from 0 to 300 rather than 0 to 100? Easily done.
  • Right click on Scroll Bar, bring up menu;
  • Click "Format Control";
  • Change the Minimum and Maximum values as you see fit.
  • (You can also change the other values, if you're game to experiment.)
Do a few formatting changes, and you have a decent-looking continuous scale:


This scale shows that I'm 71% confident that my paper will be published. You can't see the recorded value, because it is in a different sheet called "Data" (recorded in Cell A2) - the formula bar tells you that.

Just like the Likert Scale, rarely would a survey consist of one question and one only. For multiple questions, you need multiple scales; just copy and paste the original scroll bar. As with Likert Scales, you will need to define the Target Reference for each scale.

Just a few Best Practice comments:
  • Be mindful of the default value of the scale when subjects first see it. If you leave the scale at either extreme (0 or 100), it may create anchoring effects, particularly if your scale has two opposite anchoring points (eg. "Strong agree" vs. "Strongly disagree")

This brings anchoring effects galore!
  • You can eliminate anchoring effects by setting the scale to its middle value (50 if the scale is 0 to 100), by changing its Target Reference to 50. Yes, just as moving the scale would move the Target Reference value, changing the Target Reference value would move the scale too.

That's better.

Stay a step ahead,
Alex.

Saturday, September 13, 2008

How do I record a Likert scale using Excel?

I've spent the last two posts harping on about the advantages of doing surveys and experiments using Excel and VBA. It might be time to actually get into it.

Your typical social science survey usually employ more than one of the following response modes:

  • Likert scale
  • Continuous scale measure
  • Free response
  • Multiple choice response (where you can only choose one of several options)
  • Multiple options (where you can choose more than one of several options)
I'm not going into what you should use for your study. I'm just going to show you how each one can be easily presented and captured using Excel in the following entries.

This blog post will tell you:
  1. How to create a Likert scale and Multiple Choice Response item.
  2. How to record a response.
Likert Scale/ Multiple Choice

Likert Scale is probably the most popular and widely used instrument to investigate attitudes and beliefs. Whether it be 3-, 7- or 99-point scale, Excel can handle the presentation and collection of this scale easily. (Although if you have a 99-point scale, you might as well use a continuous scale measure, or risk a stern question from your Reviewer.)

I have put Multiple Choice Questions (MCQ) in the same category because, whilst having distinctly different purposes and theoretical underpinning from Likert Scales (choices in a Likert are usually of an ordinal nature; MCQs can be nominal), their functionalities on Excel are virtually identical.

What you need is something called "Radio Buttons". Open your spreadsheet; go to the "Developer" tab, go to "Control" group, choose "Insert", and choose the circle on the far right, top row.


(As I mentioned previously, I primarily use Excel 2007. If you've always used Excel 2003, this image won't make sense to you. I will provide Excel 2003 references when possible.)

(You can get the Radio Button in Excel 2003 by right-clicking on the toolbar, choose "Controls", and find the button with the same shape.)

Once you've chosen the option, your mouse cursor should turn into a cross; click anywhere on the spreadsheet, and you should get this:

You can change the words "Option Button 1" to whatever you want.

Now, having just one option isn't enough. Say we want a 7-point scale. All you have to do is copy and paste the first one that you created six times:
  1. Hold down Control, and click on the button.
  2. Release Control, then right click on the shady border.
  3. Choose "Copy"
  4. Click anywhere else on the sheet; right-click; and choose "Paste"
  5. Repeat 1-5 until you have enough buttons.
You might find that your buttons are scattered everywhere on the sheet. Drag them and line them up in your preferred manner (by holding Control --> Click the button; drag the button by its shady border.) Here, the gridlines on your sheet are your friend. When you drag the button, you can see a rectangular box lined by dotted lines following your mouse (called a Placeholder). Line this box up with the gridlines for a more consistent look.

Once you have them lined up, you have to tell the program that they belong to the same question - that is, subjects cannot select more than one option out of that group.

Go to "Developer" tab, under "Controls" group, click "Insert", choose "Group Box".

Notice that your mouse cursor has turned into a cross. Drag to draw a rectangle around the 7 Radio Buttons that you've just drawn.

Now, the program knows that only one of these 7 points can be chosen.

You can also notice that, in the above diagram, there isn't quite enough space for the middle option "Neither agree nor disagree" (you can't see the word "disagree"). You can change the size of the Radio Button by selecting the button (hold Control, Click it), and drag it by its corner (the small white dots) until it gives you a good size.

Finally, one more thing. How do I record the responses?
  1. Select any one of the radio buttons (yes, you guessed, hold Control, Click on button).
  2. Click in the Formula Bar, and press = (equal sign)
  3. Click on the cell that you want the data recorded (this is known as the "Target Reference"); in this case, I chose J3.
  4. Hit Enter.

You should see the number 3 in Cell J3. When you click on other radio buttons in this group, you will see the number change - precisely, 1 if you choose "Strongly agree", 7 for "strongly disagree", and so on.

Just a few final words of advice:
  1. In this example, I made the Target Reference in the same sheet as the buttons for illustrative purposes. In an experimental situation, you'd much rather have the Target Reference in a different sheet, to hide it from subjects.
  2. Don't be too concerned by the $-sign that goes with the cell reference ($J$3). It means exactly the same as J3; and you can change it to $J$4, $K$3, manually, if you want.
  3. This whole post talks about just creating one item. You need a different Target Reference for each item - best lined up in a logical way so that your data can be easily retrieved.
In my next post I will talk about creating other scales - but the basics of creating and recording references have basically been covered here.

Stay a step ahead,
Alex.

Monday, September 8, 2008

Why bother?

Why bother with Excel?

I mean, what's the point of doing all this programming crap? Why don't I just print a bunch of surveys, let my subjects fill them out, then I'll enter and code them?

Well, you can. But a bit of work now saves you lots of time later. And once you become familiar with the basics, not even the initial work will daunt you.

I have three main reasons why I prefer running surveys on Excel VBA:

(1) Control

The most beautiful thing about using VBA is the control you can have over your study.

My doctoral study involved two parts, first a task which contains the experimental manipulation, then the dependent response. As a general rule, I cannot let subjects see the dependent response until they have gone through the manipulation. I usually have 10 subjects per session. Now, no two people would ever complete the manipulation task at the same time, much less 10.

Had I used paper-and-pencil method, I would have to check on everyone's progress, hand out the dependent response when someone's finished, record their ID number (to make sure the two tasks match each other), put the papers into a sensible pile, etc etc. If 2-3 subjects finish the manipulation at the same time, I'd be stuffed. If one more ask me a curly question or two, the whole session would be in chaos.

What made it worse was that part of my manipulation task consisted of a number of survey questions - 180 of them to be precise. They all need to be counterbalanced. I wasn't going to print 180 different versions just for the sake of counterbalancing!

And of course, the keystone of experimental research - random assignment. I ran a 2x4 design, and for each condition, I had to hand out the manipulation and dependent measures in a different order. Maybe my memory is fish-like, but it's a pain remembering who is supposed to be in which condition! Wish I could have just pressed a button on the desk and all the right manipulation would just magically appear! ... wait, you can.

Excel VBA lets you control how your information is presented. Don't let subjects see certain material prematurely? Sure. Randomise a bunch of material? Try a few thousands of them. And response-dependent presentation of stimulus? A breeze.

Experimental studies demand control. That's what Excel VBA can do for you.

(2) Adaptability

Okay, I printed my aforementioned 180 versions of the same survey for my anticipated 400 subjects. My supervisor rings me up, "Alex, don't use the word 'satisfaction', say 'happy' in your survey". Oops. Early morning dash to the Faculty, change the survey (all 180 versions of them), frentic printing, feeling guilty for the trees as you pulp the 400 surveys...

With a well-designed VBA program, you can change everything with just a few clicks. You can still enjoy your 7am coffee at the coffee shop rather than frentically printing.

You might wish to run follow-up studies. Rather than ruining a few more soccer fields worth of trees, you can make easy minor adjustments. Or major ones.

(3) Speed

Surveys and experiments are time-consuming processes. Anything that helps you save time during and after studies are a beautiful thing.

I've lost countless hours just inputting
and coding survey responses into Excel. 7-point Likert scales I can deal with; what about continuous scales where subjects just put a dash on a line? The ruler and I became unlikely companions for some long evenings, converting millimetres into numbers, and into Excel.

Why not just record everything on Excel in the first place?!

Excel VBA not only helps you achieve quick data coding, but also enhances data collection speed. You can give the same program to as many subjects as you want, simultaneously. Why be stuck with sessions with only 4-5 respondents when you can hold 30-40 of them at once? Could save you days, even weeks, in data collection time. Spend that time do some useful work that could get you an extra publication, get noticed by the boss, play some golf - anything beats data-collection and data-entry.

My next blurb will be more useful and less lyrical in compliments, hopefully.

Stay a step ahead,
Alex.

Sunday, September 7, 2008

The Mandatory Basics

The maiden post of almost every blog seems to require a mandatory blurb with a similar introductory tone. If you are after a break from convention, you are about to be disappointed.

I am a marketing/psychology researcher who happens to know a bit about Microsoft Excel, the Glorified Calculator; and its companion event-driven programming language, Visual Basic for Applications (VBA).

(I will not even attempt to explain what "Event-driven programming" is. The Wikipedia link should be sufficient explanation for now; and in the greater scheme of things, these technical definitions are not too important. I'm sure your Reviewer won't ask what a Call Procedure is - if they do, give them my number, I want to get sloshed with them.)

During the last six or so years (3.5 of which masquerading as a marketing doctoral candidate), Excel VBA has saved me countless hours in data collection and coding. In fact, given that my studies always involved manipulation, randomisation and counter-balancing, I couldn't have done it without some form of automatic assistance. Guess I could have hired 20 research assistants to help counter-balance my stimulus material, but then I'd be more broke than I already am now.

Enough spruiking; here are a few preambles that might help you decide whether this blog is for you, or whether another Youtube video will be more interesting:
  • I'm far from an expert in the art of VBA programming. Therefore this blog will not be a definitive guide to your programming problems - it's not intended to be. This blog will specifically focus on how VBA can help you do sound experimental/survey research. Therefore, every idea here will be driven by research principles; technical sophistication comes second.
  • Since this is not intended to be a comprehensive VBA guide, I may introduce concepts that have not been covered elsewhere in the blog. For instance, I won't give a detailed explanation of what objects, procedures and methods are. Punch "Excel VBA basics" into Google, or get a VBA for Dummies book, they will give you much better explanations - but they won't be as research-focused as you'd like them to be.
  • Technical standards. Every time I refer to codes, I will write in fixed-length font:

    Sub ThisIsATestCode ()
    Sheets("sheet1").Visible = True
    Msgbox "hello!"
    End Sub

    Examples used here will refer to Excel 2007. There are some VBA commands in Excel 2007 that are not available for 2003; I will avoid using them; or if absolutely necessary, give you codes for both versions. People say Excel 2007 has a painful interface with its Ribbon and crap...I find its VBA changes even more annoying.

    Still with me? Good. Hopefully we can all move forward and do some good for the world. Failing that, a JCR will do.

    Stay a step ahead,
    Alex.